 Ruben Buijs
ICE prioritization gives a product team a fast first ranking. The ICE method, also called the ICE framework or ICE scoring model, asks three questions: how much could this help, how strong is the evidence, and how easy is it to ship?
The formula is simple. The useful work happens before the multiplication, when the team agrees what the numbers mean and exposes where an estimate is weak.
ICE score = Impact × Confidence × Ease
This guide follows one SaaS backlog from three plausible requests to a real decision. You will see how the team sets its scoring anchors, where the numbers come from, how the ranking changes the conversation, and why the highest score does not automatically enter the roadmap.
- What ICE prioritization is actually for
- ICE prioritization example: meet the backlog
- Step 1: define the scoring anchors
- Step 2: score Impact against one outcome
- Step 3: use Confidence as an evidence discount
- Step 4: score Ease with the whole delivery path
- Step 5: calculate and reorder the backlog
- Step 6: investigate why the winner won
- Step 7: decide, record the exception and move forward
- When ICE is the right model
- Common ICE mistakes
- A practical ICE session checklist
- Choose the next ICE resource
- Frequently asked questions
What ICE prioritization is actually for
ICE is a lightweight prioritization framework for comparing ideas with the same three factors:
- Impact: How much could this request move the outcome we care about?
- Confidence: How strong is the evidence behind that estimate?
- Ease: How straightforward is the request to deliver?
Score each factor from 1 to 10, multiply the three values, then rank the items from highest to lowest.
A request with Impact 8, Confidence 9 and Ease 4 gets an ICE score of 288:
8 × 9 × 4 = 288
The score is relative. There is no universal threshold that makes 288 good or 180 bad. ICE only becomes useful when every request is scored against the same goal, time horizon and written anchors.
That is why ICE works well for a quick first pass over experiments or product ideas. It takes less input than RICE, but it also ignores how many people a request reaches. If audience size differs materially, compare RICE with ICE before choosing the model.
ICE prioritization example: meet the backlog
Imagine a SaaS team planning the next six weeks. Three requests are competing for the same engineering capacity:
- Bulk CSV export: Let customers export large result sets in one action
- Salesforce integration: Sync product feedback with customer records in Salesforce
- Dark mode: Give users a lower-contrast interface option
Each request has a credible advocate.
Customer success says bulk export would remove repeated manual work. Sales says the Salesforce integration would strengthen enterprise deals. The community has voted for dark mode more than either of them.
All three statements can be true. The team still needs an order.
Before scoring, the team agrees on one outcome:
Impact means improving activation and retention during the next two quarters.
That sentence matters more than the formula. Without it, sales can score revenue impact, support can score ticket reduction and design can score user delight. The numbers would look comparable while measuring different outcomes.
Step 1: define the scoring anchors
Do not begin by asking everyone for a number. First decide what 1, 5 and 10 mean for this scoring session.
The team uses these anchors:
| Factor | 1 means | 5 means | 10 means |
|---|---|---|---|
| Impact | Barely changes the selected outcome | Creates a noticeable improvement for an important group | Could materially change activation or retention |
| Confidence | Opinion with no supporting evidence | Several consistent signals, but important uncertainty remains | Direct product data, repeated customer evidence and team validation agree |
| Ease | Large, risky and dependent on several teams | A normal project that fits inside the planning period | A small, understood change with very little coordination |
Scores between the anchors are allowed. The anchors exist so a 7 means roughly the same thing when two people use it.
The team also agrees that Ease runs upward. A 10 is easy. A 1 is hard. Some teams use Effort instead and divide by it. Either convention can work, but mixing both conventions will put the hardest projects at the top by accident.
If you want to try these anchors while reading, open the free ICE calculator in another tab. It starts with the same three requests and keeps the score hidden until you ask for the ranking.
Step 2: score Impact against one outcome
Impact is not the number of customers who asked. It is the expected effect on the outcome selected for the session.
Bulk CSV export gets Impact 8
Usage data shows that active customers repeatedly build large reports and then copy results in small batches. Interviews confirm that this workflow is slow enough to discourage broader adoption.
The request directly improves a recurring product workflow, so the team gives it Impact 8.
Salesforce integration gets Impact 9
The integration could make customer context available inside the feedback process and remove manual handoffs for larger accounts. For the customers who need it, the effect on retention could be substantial.
The expected effect is high, so the team gives it Impact 9.
Dark mode gets Impact 5
Dark mode has visible demand and could improve comfort for some users. The team cannot connect it as directly to activation or retention as the other two requests.
It gets Impact 5.
| Request | Impact | Reason |
|---|---|---|
| Bulk CSV export | 8 | Removes a repeated source of friction in a core workflow |
| Salesforce integration | 9 | Could materially improve the enterprise feedback workflow |
| Dark mode | 5 | Valuable experience improvement with a less certain effect on the selected outcome |
The Salesforce integration leads after Impact. That does not mean it will win the complete score.
Step 3: use Confidence as an evidence discount
Confidence stops a persuasive story from receiving the same weight as observed behavior.
For this session, the team treats the scale like this:
- 1 to 3: a plausible opinion or one isolated request
- 4 to 6: several consistent signals, but no direct validation
- 7 to 9: strong customer or product evidence with limited uncertainty
- 10: the important assumptions have direct, repeated evidence
Bulk CSV export gets Confidence 9
The team has usage data, recurring support conversations and several customer interviews describing the same workflow. The exact retention effect is still an estimate, but the problem is well established.
Confidence = 9.
Salesforce integration gets Confidence 7
Several enterprise conversations support the need, but the team has not validated how often the integration would be used after purchase. Sales evidence is real, while product adoption is uncertain.
Confidence = 7.
Dark mode gets Confidence 8
The vote count and comments make the demand clear. The uncertain part is whether the request will change activation or retention, which is the outcome this session measures.
Confidence = 8.
This step reveals why a written reason belongs beside every score. A team member can challenge the Salesforce value without pretending the customer conversations never happened. The disagreement becomes specific: the demand is credible, but the adoption effect is not yet proven.
Step 4: score Ease with the whole delivery path
Ease includes more than coding. Count design, engineering, data migration, testing, security review, documentation, internal rollout and external dependencies.
Bulk CSV export gets Ease 4
The existing export path can be reused, but large jobs need background processing, progress feedback and limits. It is understood work, not a small change.
Ease = 4.
Salesforce integration gets Ease 3
Authentication, field mapping, sync behavior, failure handling and ongoing support create several dependencies. The team can build it, but not quickly.
Ease = 3.
Dark mode gets Ease 8
The current design system already uses shared tokens. Some edge cases need checking, but the change fits comfortably inside one cycle.
Ease = 8.
The factor is named Ease for a reason. A higher number means the work is easier. If your team naturally thinks in Effort, rename the field and divide by Effort instead of multiplying by Ease.
Step 5: calculate and reorder the backlog
With all three factors entered, ProductLift calculates each ICE score automatically:
Bulk CSV export = 8 × 9 × 4 = 288
Salesforce integration = 9 × 7 × 3 = 189
Dark mode = 5 × 8 × 8 = 320
| Rank | Request | Impact | Confidence | Ease | ICE score |
|---|---|---|---|---|---|
| 1 | Dark mode | 5 | 8 | 8 | 320 |
| 2 | Bulk CSV export | 8 | 9 | 4 | 288 |
| 3 | Salesforce integration | 9 | 7 | 3 | 189 |
Dark mode wins, even though it has the lowest Impact. Ease changes the order.
Inside the ProductLift ICE workflow, enter the three factor values beside each live request, then reorder by score. The votes, customer segments and revenue context remain visible while the list moves. You can see immediately whether a quick win is genuinely valuable or merely easy.
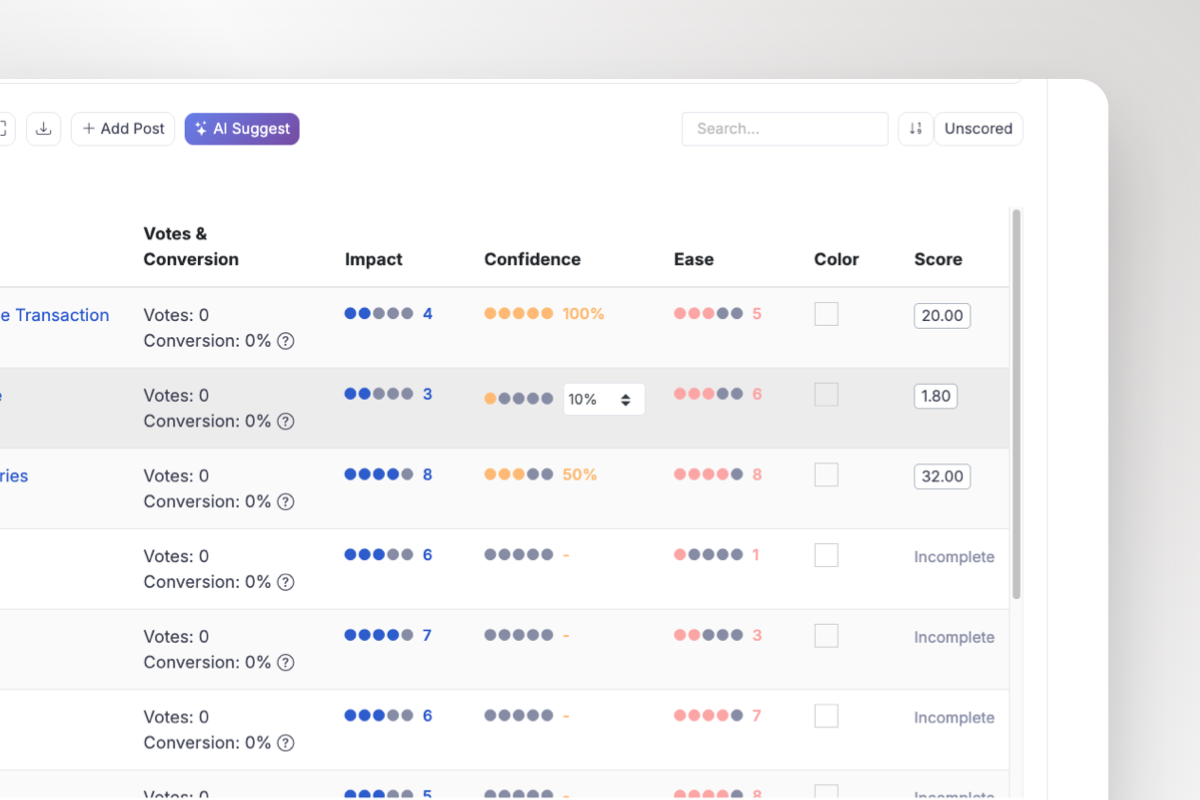
The factors and score stay attached to the request, so the team can inspect the evidence before accepting the order.
If you only need the calculation, use the ICE calculator. Edit the example rows, add more requests or import a CSV. The tool reveals and sorts the score only after you click Score requests.
Step 6: investigate why the winner won
The ranking does not say “build dark mode.” It says:
Dark mode ranks first because the team believes it is much easier than the alternatives, while its Impact and Confidence remain credible.
That is a useful claim to inspect.
The product manager asks engineering to explain Ease 8. The estimate depends on shared design tokens covering nearly every screen. A short audit finds several embedded charts and email previews that do not use those tokens. Ease drops from 8 to 6.
The new score is:
Dark mode = 5 × 8 × 6 = 240
Bulk CSV export moves to first place with 288.
ICE did not fail. It identified the assumption that mattered most. The team learned where a small amount of investigation could change the order.
Use this question for every high-ranking item:
Which single factor is doing most of the work, and what evidence would make us change it?
That turns the score into a research plan instead of a decorative number.
Step 7: decide, record the exception and move forward
Suppose the Salesforce integration is required for a signed customer commitment. Its ICE score remains 189, but failing to deliver it would create a contractual and commercial risk outside the model.
The team may still schedule Salesforce first.
Do not inflate Ease or Confidence until the desired request wins. Keep the honest score and record the exception:
Salesforce is scheduled first because of a signed commitment. Its ICE score remains 189. Bulk CSV export is the highest-scoring discretionary request.
Common reasons to override ICE include:
- legal, security or regulatory obligations;
- signed customer commitments;
- a hard dependency needed by several other projects;
- maintenance required to keep the product reliable;
- a strategic choice to favor a smaller audience;
- capacity constraints the Ease estimate does not capture well.
In ProductLift, keep that explanation in an internal comment, move the selected request to the roadmap and connect the delivery work. When its status changes, the voters and original discussion remain part of the same history.
When ICE is the right model
ICE is useful when:
- the team needs a fast first pass over many ideas;
- reliable Reach data is not available;
- the items belong to the same goal and roughly the same decision horizon;
- speed and ease of delivery should influence the order;
- the team wants to expose uncertainty without building a complex model.
ICE is less useful when:
- one request affects 50 customers and another affects 50,000;
- contractual or strategic constraints dominate the decision;
- the team cannot agree on one outcome for Impact;
- every item receives roughly the same score;
- dependencies determine the order more strongly than value does.
When audience size matters, RICE separates Reach from Impact. The RICE versus ICE guide scores the same backlog with both methods and shows why the winner can change.
Common ICE mistakes
Starting with numbers instead of anchors
If one person treats Impact 8 as “customers will like it” and another treats it as “retention will materially improve,” the table is not comparable. Define 1, 5 and 10 first.
Using Confidence as personal certainty
Confidence measures evidence, not how strongly someone believes the idea. Ask what observation, customer pattern or test supports the number.
Forgetting that Ease runs upward
High Ease means low delivery difficulty. If your column says Effort, invert the scale or divide by it. Do not multiply high Effort into a higher priority.
Scoring unrelated work together
Do not compare a security obligation with a growth experiment and a minor design cleanup as if the same model decides all three. Filter the candidate set before scoring.
Treating 320 as objectively better than 288
The inputs are estimates. A small score difference should trigger discussion, not false precision. Investigate which assumptions make the order change.
Leaving the result in a spreadsheet
A spreadsheet is useful for a workshop, but it becomes stale when feedback, estimates or roadmap status changes. Use the free ICE prioritization template when a portable file is enough. Use ProductLift when the score must remain connected to the request and its delivery history.
A practical ICE session checklist
Before the session:
- Select one outcome and one decision horizon.
- Choose a comparable set of requests.
- Write anchors for Impact, Confidence and Ease.
- Bring customer, product and delivery evidence into the room.
During the session:
- Score independently before discussing the numbers.
- Compare large disagreements by factor.
- Record one reason behind every unusually high or low input.
- Calculate and reorder the complete list.
- Inspect the factor that most influenced each winner.
After the session:
- Record any deliberate override without changing the honest score.
- Move the selected requests into planning.
- Assign research to promising requests with weak Confidence.
- Revisit the scores when the evidence changes.
The framework is successful when the team can explain the order, not when the spreadsheet contains perfect numbers.
Choose the next ICE resource
- Want to rank requests now? Use the free multi-request ICE calculator.
- Want a portable spreadsheet? Download the ICE Excel template.
- Unsure whether Reach matters? Read RICE vs ICE.
- Want scores connected to feedback and delivery? See ICE prioritization in ProductLift.
- Comparing the full workflow? Explore the ProductLift prioritization module.
Frequently asked questions
What does ICE stand for?
ICE stands for Impact, Confidence and Ease. These three values are multiplied to create a relative score for comparing requests.
What is a good ICE score?
There is no universal good score. Compare items scored by the same team, with the same anchors, for the same goal and time horizon.
Should Ease or Effort be used?
The standard ICE label is Ease, where a higher value means easier work. A team can use Effort instead, but it should divide by Effort or invert the scale.
Is ICE better than RICE?
Neither method is always better. ICE is faster and needs less data. RICE adds Reach, which helps when the number of affected users differs materially between requests.
Can ICE decide the roadmap automatically?
No. ICE creates a comparable first ranking. Strategy, dependencies, obligations and evidence still require human judgment.
Last updated on Oct 7, 2026